
Let’s get one thing out right away–autism prevalence studies undercount. Not all autistics are diagnosed. That’s just a fact. Consider the recent CDC study. They look at school and medical records. In many cases, they find children are autistic based on their records–but the schools and doctors hadn’t diagnosed those children.
Combining data from all 11 sites, 81% of boys had a previous ASD classification on record, compared with 75% of girls (OR = 1.4; p<0.01).
Yeah, more than 20% of the kids counted in their prevalence had no diagnosis. They and their families didn’t know.
And, if there isn’t enough in the records to show a kid is autistic? That kid gets uncounted altogether.
So, when people look at the CDC prevalence estimates from over the years and cry “epidemic”, well, there’s a reason why those people usually have some causation theory that they believe in. The irony is that they are usually wrong that their theory needs an epidemic to support it. But, heavily biased people are not usually the best sources of reliable analyses.
What would be a better method of counting how many autistics are in a population? Sounds obvious–test all the kids in a given population. Equally obvious–this is a much more expensive and difficult task. One such study was published in 2011. Yes, 7 years ago. In Prevalence of autism spectrum disorders in a total population sample, the autism prevalence in Korea was found to be 2.63%. A study performed in South Carolina and reported at IMFAR last year found a prevalence of 3.62%.
This all said, we had another autism prevalence come out this week–The Prevalence of Parent-Reported Autism Spectrum Disorder Among US Children. This study found a prevalence of 2.5%.
Now here’s a nice thing about this recent study–OK, two nice things. First, they don’t just look at kids of one age. Second, you can obtain the data. Which I did. Let’s look at the autism prevalence broken down by birth year.
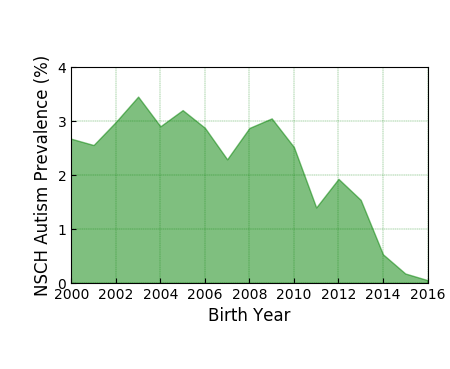
Do you see autism prevalence increasing with birth year? I don’t. I see some scatter, but in general the autism prevalence is about 2.5% from birth year 2000 to 2010. For what it’s worth–the scatter is due to the small numbers of kids in each year making the value uncertain. It’s statistical noise.
If you are wondering about how the autism prevalence drops off above birth year 2010, keep this in mind: kids aren’t diagnosed at birth. In the CDC study, 1/2 of the kids didn’t get diagnosed until after 52 months (4 years 4 months) of age. For this type of reason, the more recent study didn’t count kids under 3 years of age.
People are very fond of graphing autism prevalence data from various years and claiming these are accurate, full counts of autism prevalence (they aren’t) and, from that, claiming an epidemic. Here are the CDC data:
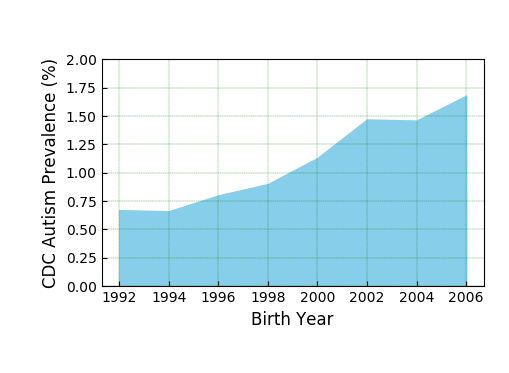
The numbers go up. Steadily up. I’d have to be a total denialist to not see that as evidence of an epidemic, right?
Consider this–the CDC autism prevalence for birth year 2000 is 1.1%. The study just out gives an autism prevalence more than double that (2.9%). For the same birth year. Both are good studies, for what they are. Both are limited. But, for one thing, the CDC study was performed in 2008. 10 years ago. Since then a lot has changed. For one thing, the kids got older and had more chances to get diagnosed. They didn’t just suddenly become autistic in the past 10 years.
So, yeah, we have an autism prevalence estimate of 2.5%. I’m not surprised and I’m not taking this as evidence of an epidemic.
The unfortunate thing in this discussion is that with all the work in this study, all the potential for advocacy, the only number that usually gets discussed is the overall prevalence. Watch the video abstract (which I can’t get to embed). One of the authors goes into a lot of detail about the other findings. Findings I hope to discuss soon.
//players.brightcove.net/1327978102001/rkA3rSifl_default/index.html?videoId=5839990273001
—
By Matt Carey

Thank you for going through this – it’s incredibly helpful.
One aspect of autism prevalence fluctuation is the identification of those with lower needs that account for the majority. You know, those who wouldn’t have been identified in years past.
You just aren’t making comparisons far back enough.
really?
Tell me, which study from far enough back gives us a comparison to today’s numbers? Which study, using the same methods and understanding of autism, from the past shows evidence of an actual increase?
I’ll answer that for you–there isn’t one.
However, this study shows, that from 2000 on, the autism rate is basically flat.
It also shows, that for kids born as early as 2000, the autism rate as higher than previous studies would indicate.
All these are, of course, within the limitations of the study. BUT–the idea of an epidemic is based on such a limited logic that it is miles away from being as clear as this example.
Sorry–I know the epidemic is important to those who push the idea that vaccines cause autism. I know it’s the weapon of choice for instilling fear in vaccines. I know it is the way a community of science denialists use and abuse the autism community.
It’s just not an idea based in real fact.
great example of the depth of logic behind the epidemic. “I don’t like your analysis. I won’t take the time to actually analyze it and discuss it. Just dismiss it”
“You just aren’t making comparisons far back enough.”
Under which DSM? Also, what level of autism as defined by DSM V. Should we limit it to Level 3, or is it okay to include Level 2? How about type of autism with known genetic sequences? Which ones on this list (which is about to get bigger) should we include:
Click to access SPARK_gene_list.pdf
The autism increase is real: https://corticalchauvinism.com/2018/04/30/autism-and-other-health-related-epidemics/
The increase in diagnoses is real. No one doubts that.
But denialists who refuse to acknowledge the large number of undiagnosed and underserved autistics are directly harming the community in order to promote their own political agenda.
Here is information from actual researchers of autism: https://sparkforautism.org/discover/
More about the fact of autism increase:
[link removed by site admin]
I am not here to host links to NCSA. It’s an organization whose purpose is directly opposed to the well being of my child. So I will remove your link.
Wow,
NCSA is quoting a paper by Mark Blaxill. Mr. Blaxill is, well, a liar. He’s an anti-vaccine activist, science denialist and worse. He’s responsible for many disabled children being subjected to chelation. In animal models, chelation has been shown to reduce cognitive function.
Be proud, NCSA. Be proud.
I once interacted with Mr. Blaxill. He had written a long, convoluted and wrong post. Ironically in an area supposedly in his professional expertise, but I digress. I politely pointed out to Mr. Blaxill that his facts were wrong. I provided the evidence (easily found with a 5 minute web search). He denied my evidence (which he later used) and said he’d leave his false information up until the subject of his attack did what he wanted. Which basically showed all he was doing was (a) attacking and (b) trying to blackmail.
And this is the sort of expert NCSA relies upon.
They must be so proud of themselves. They’ve sunk to ally with the most unethical branch of the autism parent community.
wow, what a junk paper. I literally laughed out loud at this
So, one minor paper and the Autism Society of San Francisco means that this is the most reliable record of autism prevalence trends? SFASA is led by one of the highly science ignorant (ironic given her hobby) people who started NCSA.
CDDS has been very careful to note that their data are not the gold standard that people like Mr. Blaxill have claimed over the years.
Here’s a comment from their own report of a decade ago:
Mr. Blaxill was part of the community that abused the CDDS data for years, claiming it showed that mercury in vaccines cause autism. Even though he still believes that these data are so strong, he has refused to acknowledge that these data show that he was wrong about mercury. Completely and utterly wrong. And his advocacy in that regard led many parents to the world of guilt and shame, and led many autistic children to be subjected to horrible “cures” for fake vaccine injury.
Well done, NCSA. Your mindset is very much like those of the vaccines-cause-autism crowd. In more ways than in shouting “epidemic” at the drop of a hat.
Too bad your jobs have been to serve all autistics. Even those who were undiagnosed. By denying their existence, you failed to provide them the support they needed.
Prove that this graph is not a evidence of the autism increase: https://nutritionreview.org/wp-content/uploads/2013/04/autism1.jpg
Prove it is.
Show me data that using the same methods and understanding of today that the “autism rate” for, say, 1970, is what you claim it is in the graph.
You can’t. Because the data don’t exist. I’ve asked for the studies to be done. Have you? Do you give a damned about the undiagnosed, the under-served? Those going through life without the support that a better understanding of their situation brings? Or are you so wedded to an epidemic for whatever reason that you must deny this population?
Why not start with accepting the possibility that a lot of autistics go undiagnosed. The possibility. Then it is incumbent upon you to advocate for better identification, because that will lead to better supports, better lives for those people.
“I have a graph!!! It’s an EPIDEMIC!!!”
Been hearing that for a LONG time. Scientifically illiterate people have been the bane of the autism communities forever. It’s time for a change.
(also, note that graph comes from survey data collected by the Autism Research Institute. Do you understand the term biased dataset? Do you understand the many of the people who would be contacted by ARI believe in vaccines cause autism. It’s very sad that Rimland had to end his career promoting that. Do you understand that these aren’t real data but a survey? No confirmation whatsoever? Either you do and you are promoting pseudoscience for some agenda or other, or you don’t understand and you shouldn’t be trying to debate science.)
1) You don’t explain how that data could be biased. Also, Rimland wasn’t dogmatic about that.
2) Diagnostic criteria never excluded children with onset of symptoms at 18 months.
You don’t understand how the data could be biased? Seriously, you are admitting you are that ignorant? There is no point to this discussion.
Herbert,
No, I will not approve your comments using different email addresses. You demonstrated a lack of the basic understanding of how to analyze the information under discussion. Clearly you are just trolling here, either consciously or not. Go find someone else to “debate” with. Or, better yet, educate yourself.
That is the last response you will receive here.
1) You don’t explain how that data could be biased. Also, Rimland was dogmatic about pushing dangerous biomed ‘treatments’ for autism.
2) Before the 1980s, autism criteria excluded children with onset of features at 18 months, consigning them to labels of ‘childhood schizophrenia/psychosis’, ‘mental retardation’ (sorry), and ‘brain damage’ instead.