
When people claim that shelter in place orders didn’t save people, they are just wrong. When people say we didn’t “bend the curve”, they are just wrong. And this sort of misinformation will lead to people dying.
This is obviously a non autism post. Sadly, the same people (many of them autism parents) who have spent years promoting misinformation about autism, autism ‘cures’, and vaccines are now talking about the COVID-19 pandemic. So I felt it appropriate to speak to some of this misinformation.
This is also a lot of graphs. But the bottom line is simple: we were in a runaway situation. Cases were doubling every 5 days. In a few weeks after shelter in place we would have had our hospitals overwhelmed.
There is a push against the shelter-in-place orders that were put in place to slow the spread of the virus SARS-CoV-2. I’m sure we will be debating for years to come what the best plan should have been. But what is not a debate is whether the shelter in place orders limited the spread and, in so doing, saved lives.
I live in Santa Clara County, which was one of the first counties to institute shelter-in-place (SIP) on March 17, 2020. While I was surprised by the order, the reasoning was already becoming clear: the virus was spreading in our county at an alarming rate. I had been watching the numbers day by day, and we were seeing a case count doubling every 5 days. New York City was clearly seeing the start a huge outbreak at this time.. In a little over a month previous Italy had seen deaths rise from near zero to 6,000 per day. That’s one month.
I pulled the data to see what happened here in Santa Clara county. And, more importantly, what could have happened.
Here’s a graph that would have faced the public health staff in Santa Clara County in mid March:
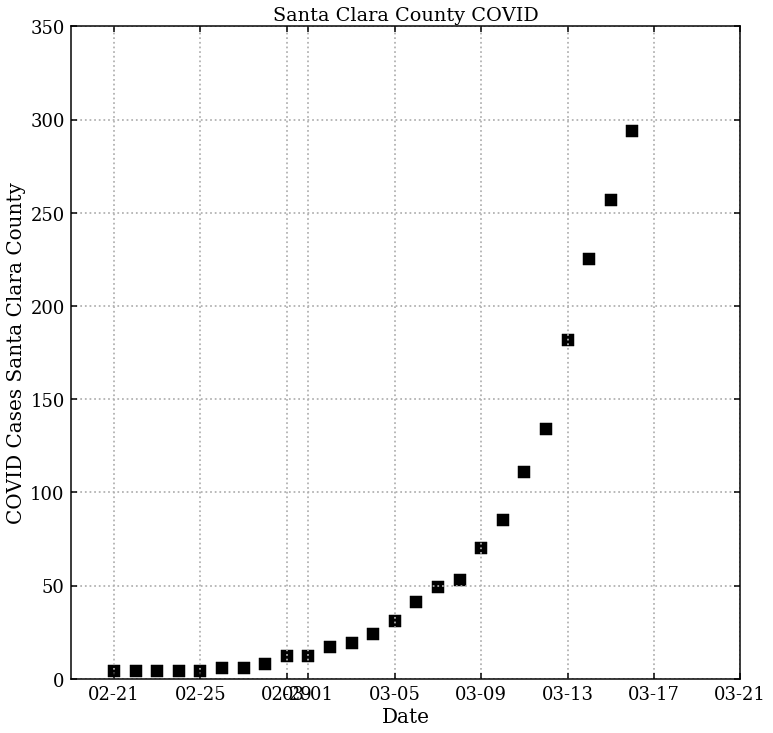
Looks like an exponential, and this is exactly what it is. Cases were growing fast. Here’s a fit to those data using an exponential growth curve:
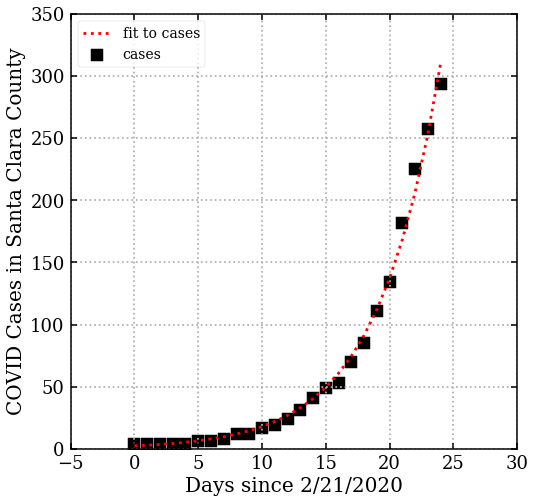
That’s a very good fit to the data. Cases were doubling every 5 days. With that sort of growth, we were not very far behind NYC. Keep in mind, this is just a count of who was being diagnosed with COVID-19. A lot of cases were not, so there was a lot more COVID in the community than these few hundred cases. The shelter in place order is at day 25.
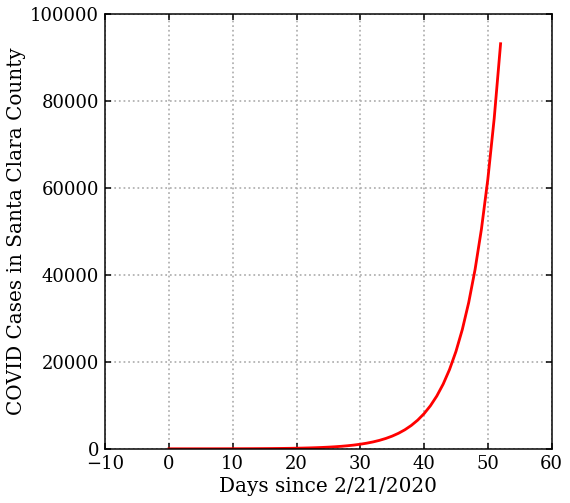
Put yourself in a public health official’s place. You see these data, what does that tell you about the future? Well, since it’s an exponential, we can use the fit to predict. Consider 4 weeks out from the date of shelter in place. Ask, how much would the epidemic have grown in that time? The curve tells us: we would have grown to about 93,000 identified cases (assuming testing could keep up).
When you are covering this much of an increase, it’s often helpful to use a semi-log plot. In that case the exponential curve is a straight line (same data, graphed differently):
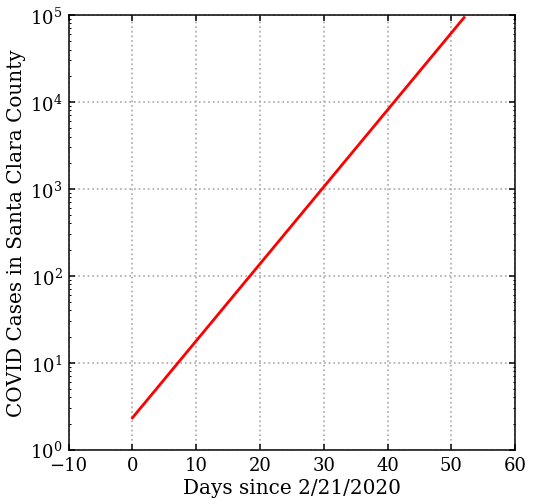
Let’s overlay the actual case count on top of this line. We can ask ” did we bend the curve”? Absolutely. Here are the data:
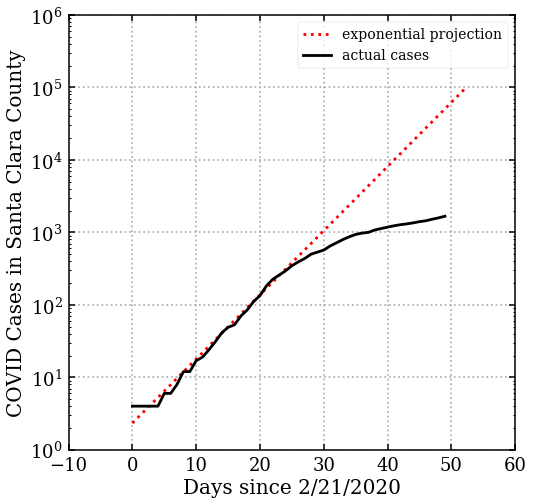
Very soon after the shelter in place order (day 25) the case count diverges from the projection. The curve was being bent. By 4 weeks out from the shelter in place order, and the number of cases was 50 times lower than what would have happened without any actions to mitigate the spread.
50 times lower.
This is even more clear if we go back to a non log plot:
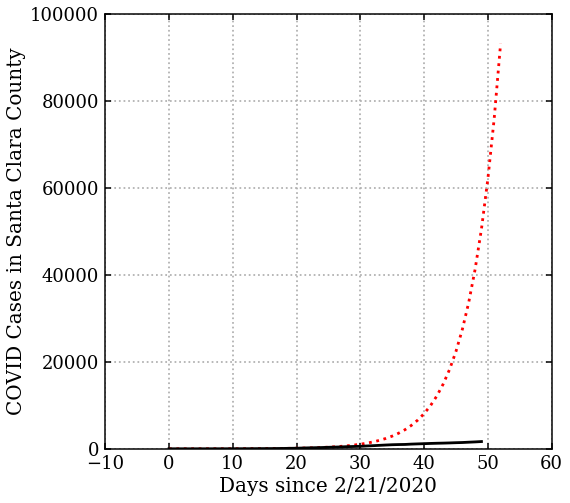
You can barely see the black line for the case count on this graph. By day 50, the actual number of cases is well below the prediction. And that means lives were saved.
At the time, the fatality rate was unclear, there were estimates of about 4% of those identified as covid positive dying (the “case fatality rate”). Current statistics put the case-fatality rate in the U.S. at about 2.9% . With 3% case fatality, we were looking at almost 3,000 people dead by a month after the shelter in place . And that number would have continued growing steeply had we not taken measures to mitigate the spread.
It is worth keeping this in mind: if the hospitals were overwhelmed, the case-fatality ratio would have been higher. More people would have died. 90,000 cases would have absolutely overwhelmed our hospitals. Even with the extra capacity in the temporary hospital set up in our convention center. That hospital had only 250 beds. Not all of the 90,000 cases would have required hospitalization. But there would have been enough to swamp our hospitals.
Santa Clara County lost about 150 people in the first wave of the pandemic (it’s hard to say precisely where the cutoff for “first wave” would be, but somewhere about 150-200 looking at the trend). It could have been 10 times higher, or even more than that.
When people claim that shelter in place orders didn’t save people, they are just wrong. When people say we didn’t “bend the curve”, they are just wrong. And this sort of misinformation will lead to people dying.
—
By Matt Carey

Could you please unsubscribe me from you email list, The unsubscribe botton at the bottom is not working.
Thanks you
I can’t find the email you used in the comment in the subscriber list.
The worst part of it is, we’ve already proved this a century ago during the influenza pandemic.
Both shelter in place and wearing plain cloth masks, but we insist on repeating the mistakes of the past.