
Kennedy wants us to believe that autism was vanishingly rare when he was young. Instead, he’s revealed something much simpler: he didn’t know what autism looked like.
Robert Kennedy Jr. often tells a story meant to bolster the idea that autism is a modern epidemic. When he was a teenager, he volunteered at the Wassaic State School in New York. His takeaway? He never saw anyone with autism. The implication is clear: autism must be new. An epidemic, and one caused by vaccines. But there’s a problem with his story: there were a lot of autistic people at Wassaic.
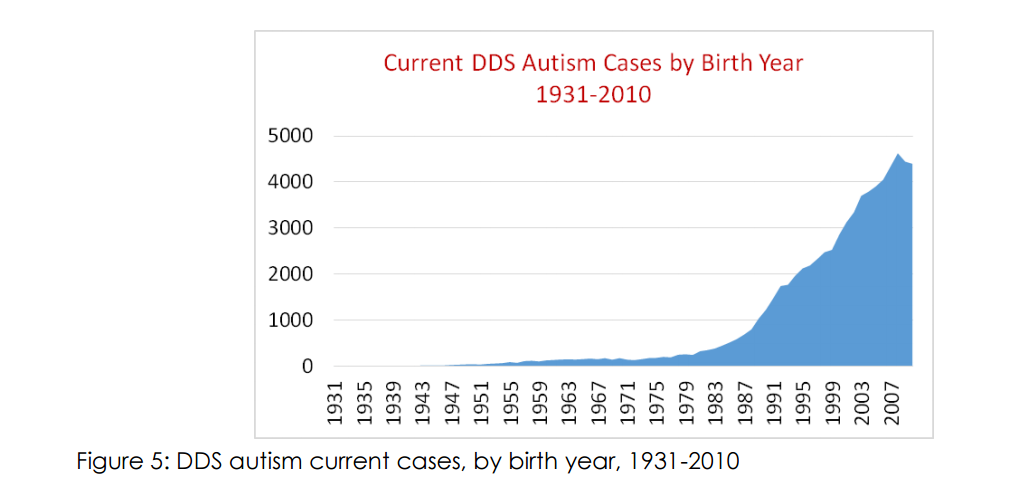
At best, Kennedy’s story reveals more about his own lack of awareness than it does about autism. Based on data from the California Department of Developmental Disabilities (CDDS)—data Kennedy himself has cited in various arguments—to support the idea that autistic people were indeed present in institutions like Wassaic in significant numbers during the time he volunteered there.
His revisionist anecdote is standard in the “autism epidemic” playbook. First, you take old prevalence studies at face value—as though diagnostic practices and awareness haven’t changed dramatically over the decades. In the 1970s, autism was estimated at around 3 in 10,000. Wassaic housed somewhere between 2,400 and 5,000 residents at the time. If you apply that (outdated) prevalence rate, you might expect only one or two autistic individuals in the entire institution.
You can be forgiven if you don’t see the logical flaw in that argument. Apparently, Mr. Kennedy cannot. The autism prevalence in a place like Wassaic would have been much higher than that in the general population. 3 in 10,000, even if it were an accurate autism prevalence, is not the number to use. Pretty obvious once it’s spelled out.
So let’s do what Kennedy doesn’t: look at the numbers. Let’s ask how many autistic people were at Wassaic.
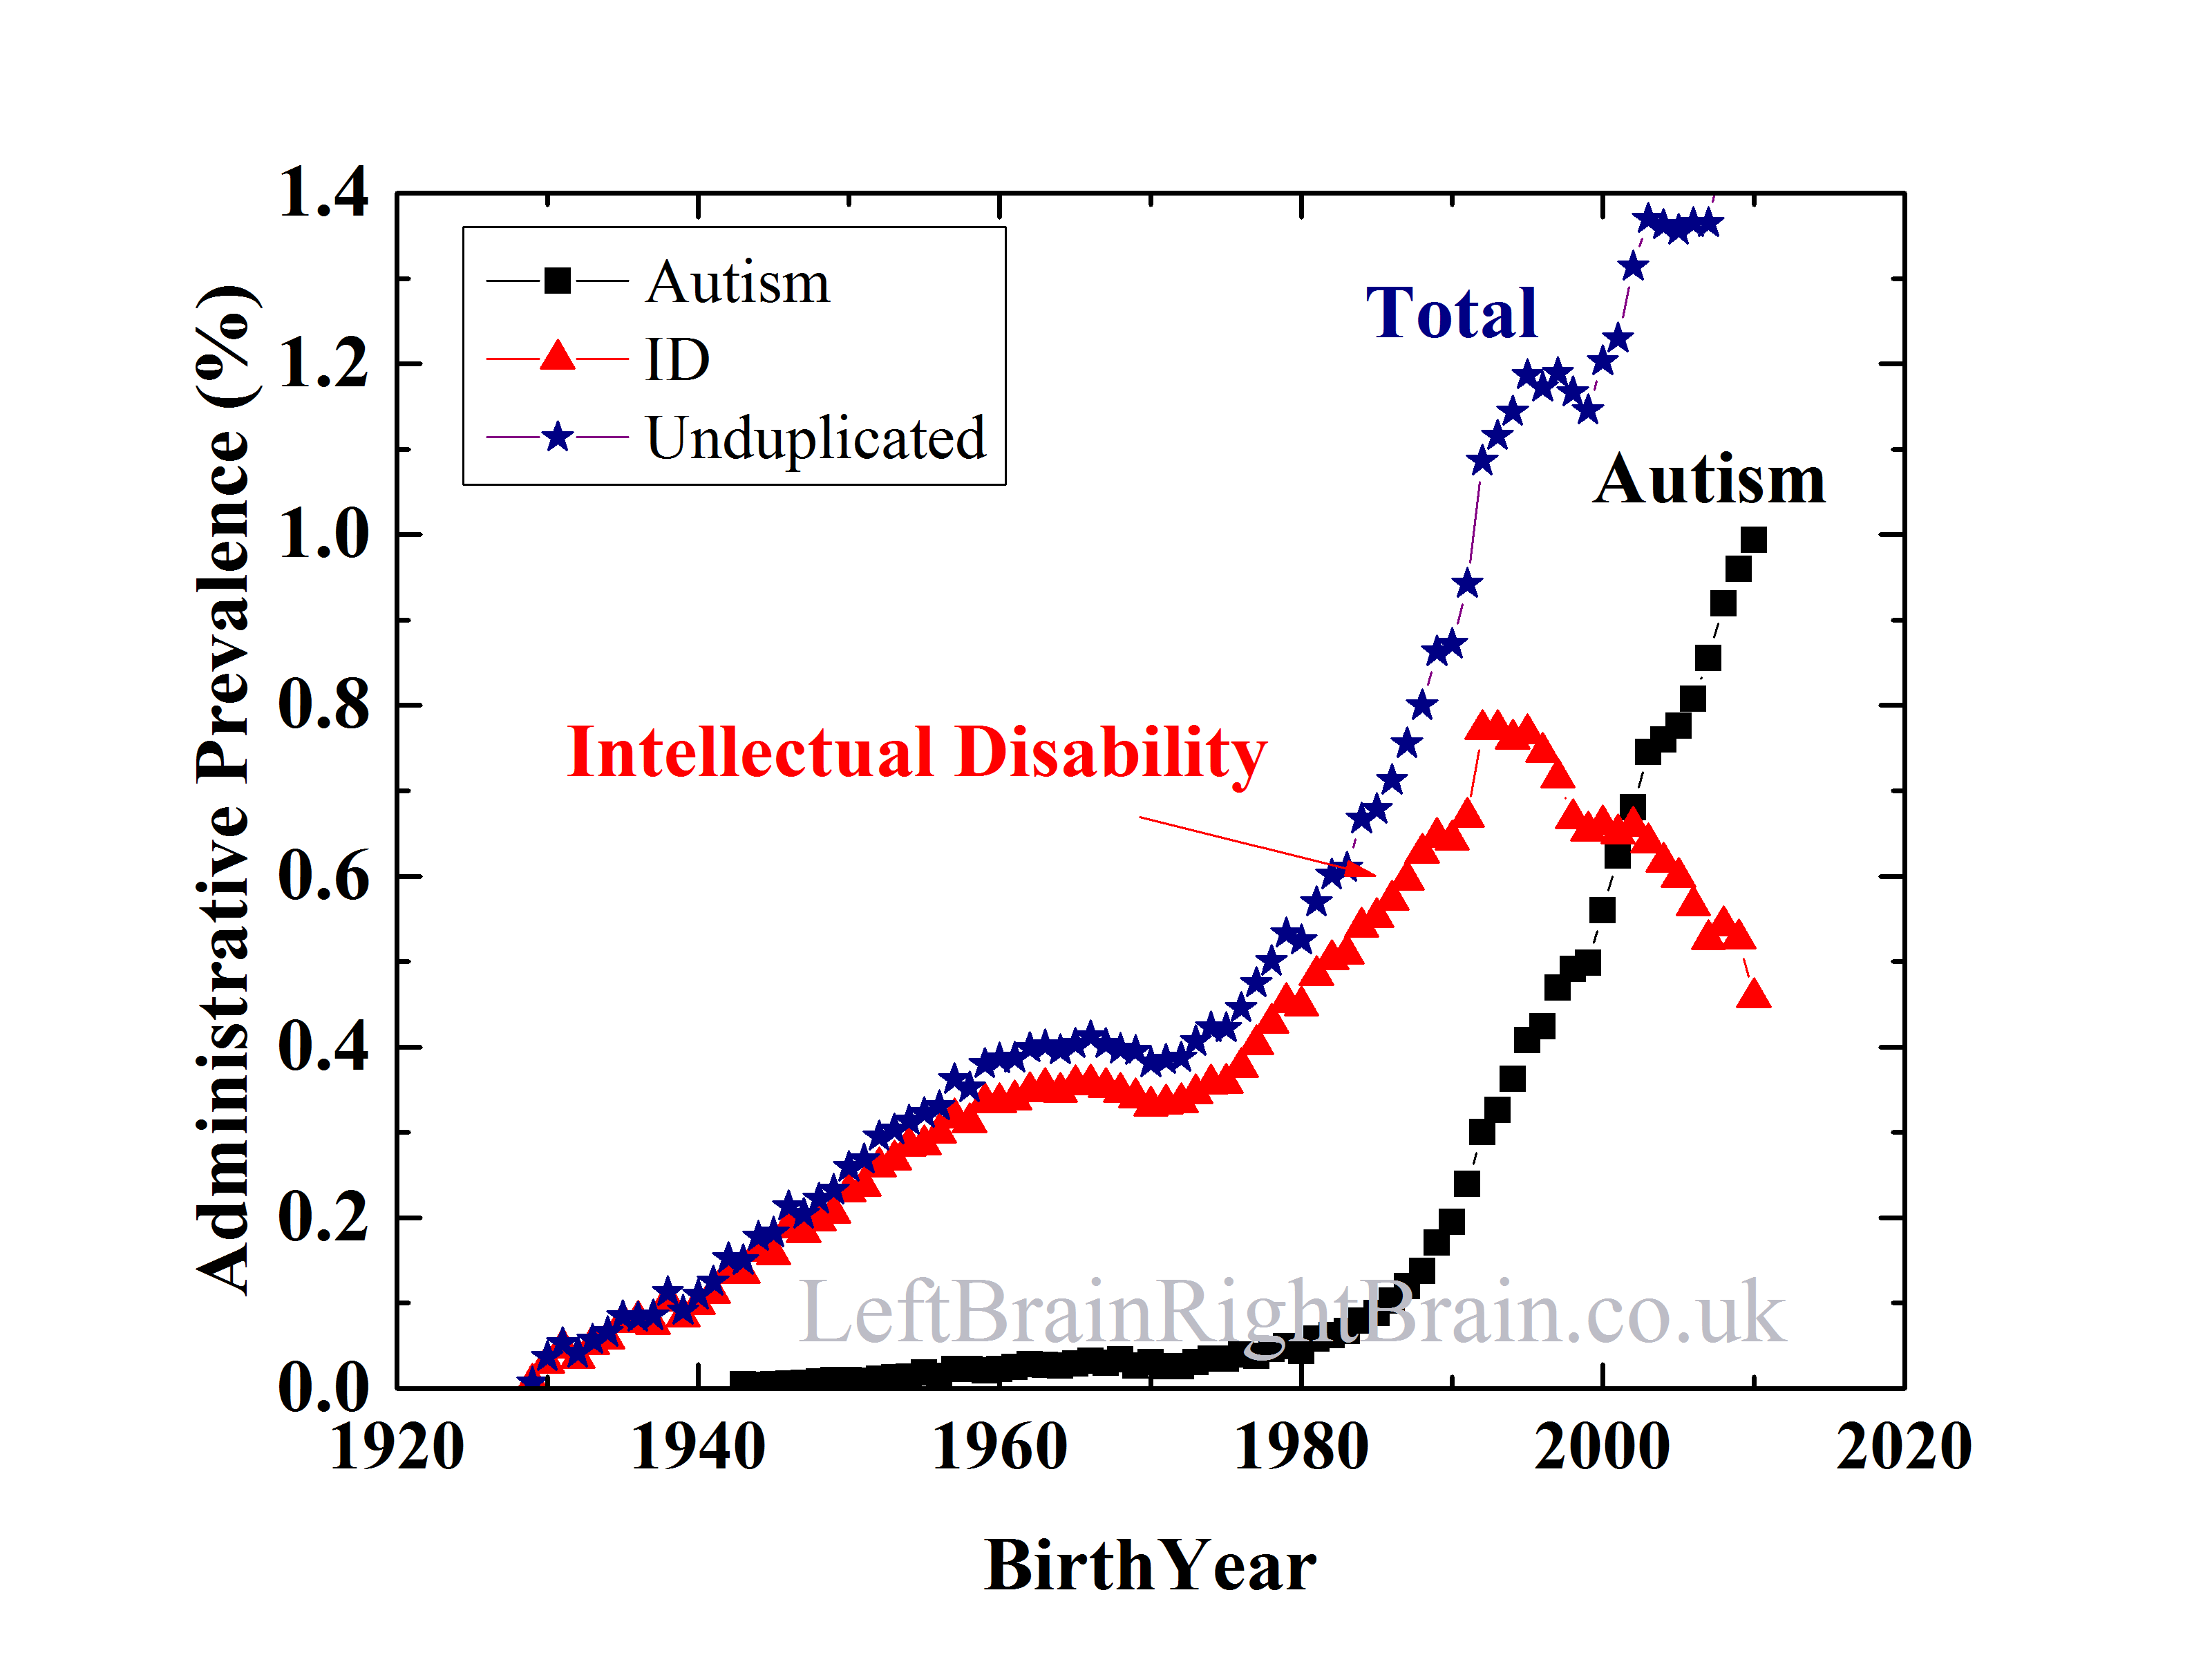
I examined a historical dataset from the CDDS* and asked a simple question: for individuals born around the same time as Kennedy (and, thus, would be representative of the age of students at the “school”), how many are recognized as autistic compared to those with intellectual disability (ID)? The answer: about 1 in 20. Implicit in Mr. Kennedy’s logic is that many or most of these autistic people would have been at places like Wassaic.
So, if you are looking at a population of people with developmental disabilities in 1972, you’d expect one diagnosed autistic** for every 20 people with intellectual disability. That one person probably is both autistic and intellectually disabled. So, on average, every classroom group Mr. Kennedy would have seen would have a recognized autistic person. Or, to put it another way, ff Wassaic had 5000 residents, there’d be about 250 autistic people.
Kennedy states he didn’t see recognize anyone who was autistic at Wassaic. And why would he have understood the people he saw were autistic? He was about 18 years old. Even now, he’s not a doctor. He’s not trained in neurodevelopmental disorders. The idea that he could identify autism in a mid-century institutional setting, from his memories as a teenager, is implausible at best.
So Kennedy wasn’t seeing too few autistic people. They were there. He was simply unable to recognize them.
This isn’t a complicated scientific issue. It’s about context, data, and critical thinking—qualities Kennedy claims to value but rarely applies. And that matters, because his ignorance has consequences.
Kennedy uses the “autism epidemic” narrative to stoke vaccine fear. He’s spent two decades promoting misinformation that undermines public health. Today, people are dying of preventable diseases in places like Texas because of narratives like his.
But my reasons for writing this go beyond public health.
This matters because it hurts autistic people. When Kennedy claims that autistic individuals didn’t exist before, he erases generations of people who went undiagnosed and unsupported. It’s not just bad science—it’s dehumanizing.
If Kennedy wants to lead, he needs to start by recognizing the people he claims to care about.
By Matt Carey***
*Here’s a screenshot of the spreadsheet I got from CDDS. It is from 2015. I added a column with the ratio of consumers in the autism category to the ID category. For people born around the same time as Mr. Kennedy, the age group likely represented at Wassaic when he was there, it’s about 1:20. I.e. for every 20 people at Wassaic with ID, there was at least one autistic individual. All this without saying “they weren’t diagnosed”.

Once, again, I’ll stress autism was vastly undercounted then. I have literally hundreds of articles on this blog discussing this.
**and a lot more undiagnosed autistics, but that’s the logic Mr. Kennedy and his community denies.


Recent Comments