Archive | Science RSS feed for this section

One line from the CDC Autism Prevalence report you will likely never see quoted

28 Apr

The CDC came out with an autism prevalence estimate a few days ago. There have been a number of news stories on the subject and the usual attempts by credulous websites to use this to claim that vaccines cause autism.

It’s right there at the top, in the interpretations section of the abstract:

Because the ADDM sites do not provide a representative sample of the entire United States, the combined prevalence estimates presented in this report cannot be generalized to all children aged 8 years in the United States

The Age of Autism blog (as noted already, always a good place to look for people getting it wrong on autism) ran a piece “Breaking News: 1 in 59 children Born in 2006 have Autism, 1 in 36 between the ages of 3 and 17. What’s going on?” Because, you know, claiming an epidemic is in their mission statement.

SafeMinds, another organization promoting the failed “vaccine-induced-epidemic” idea of autism wrote:

Baltimore, MD, April 26, 2018 – SafeMinds, along with other national autism advocacy organizations, sent a letter today to Department of Health and Human Services (HHS) officials demanding a meeting within the next 30 days to discuss the creation of a Federal Autism Strategic Plan to address the nation’s autism crisis. The urgent letter follows the release of a report this afternoon by the U.S. Centers for Disease Control (CDC). The CDC report found that autism is now diagnosed in one in every 59 American children, representing 2 ½ times more autism in 12 years and a 15 percent increase in just two years.

First, there is an Autism Strategic Plan. A member of SafeMinds helped craft it with HHS while she was on the Interagency Autism Coordinating Committee. She voluntarily decided not to pursue another term on the IACC.

Second, your reason is that ” The CDC report found that autism is now diagnosed in one in every 59 American children”. The CDC told you explicitly in the first few paragraphs that can’t be said.

But I do appreciate that you are implying no epidemic among children. You clearly state that the rate is the same for all American children, not just the 8-year old children of the CDC study. Or did you miss that important point?

So, good luck with that letter. I’m sure your readership will not notice the problems with your logic, but HHS will.

There are more examples, but these make the point.


By Matt Carey

Did autism prevalence increase by 20%? (answer: no)

28 Apr

The CDC came out with a new autism prevalence estimate yesterday. Their estimated autism prevalence is 1.68%.  That’s up from the estimate from 2 years ago (1.46%), but lower than a different recent study (2.76%).

I’m going to discuss some minor-league shenanigans.  It’s no surprise that some groups abuse facts and cherry pick data to make political points.  In this case it was useless.  there was no need to cherry pick.  I’ve done a lot of exposing the abuse of facts by some so-called autism advocacy groups.  I don’t get any joy from noting that people in my community are both dishonest and ignorant of science.  But much as that bothers me, it pales in comparison to the lost opportunities.  Millions of dollars were spent on this prevalence estimate alone, but all some groups do is dig for reasons to justify their “epidemic” story and push the long-ago failed idea that vaccines are to blame.

Over the years, news organizations and autism groups have jumped at the chance to put their spin on each new CDC autism prevalence estimate. Over the years I’ve spent a lot of time trying to unspin the takes of groups like the Age of Autism blog. AoA is, well…if you want to see autism done wrong, read the Age of Autism blog. Science, medicine, human rights and dignity, they can be counted upon to get things wrong.

With that in mind I decided the CDC announcement was a time to break my current trend of ignoring AoA. I literally haven’t read it in months. What I saw was both surprising and typical for them. Surprising in that they didn’t even bother to write their own pieces for the new prevalence numbers. Seriously–they just copied a couple of articles from other sites and left it at that.

By the way–this new low-level interest in autism prevalence appears to me to be a general trend–beyond just AoA. Autism is losing it’s status as having intense focus from the US media and public.  The chance to leverage the public’s interest into meaningul change is waning. That’s a far more interesting topic and far more important than this and I want to come back to it in the future.

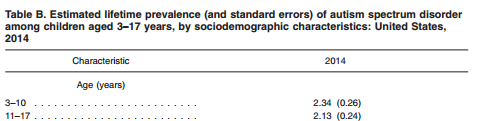
So, what did AoA post? Big League Politics BREAKING: CDC Reports 20 Percent Autism Increase In Children and Breaking News: 1 in 59 children Born in 2006 have Autism, 1 in 36 between the ages of 3 and 17. What’s going on?. That first one caught my eye. First because in absolute terms, the autism prevalence increased by 0.22%. In relative terms, that’s about a 15% increase.  They could have said 15% and made their point, but why do that when 20% is even more scary?  More to the point–digging just a little into this 20% figure gives understanding that a true advocacy organization could use.

So how did they come to the idea that the autism prevalence increased by 20%? They skipped to page 13 and took one part of one paragraph out of context and, well, cherry picked. Completely unsurprising. They skipped over pages of data showing that we are failing to identify–and, therefore provide adequate services for–autistic minority children.

Sadly, AoA and their allies have spent over a decade denying this huge issue.   The reason is obvious: it doesn’t fit into the “vaccines cause autism” narrative.  So rather than push for better identification and better services for minorities, they’ve sacrificed these communities in for their political message.

It’s disgusting.

They didn’t dig any deeper into these numbers, even though the data were right in front of them. Also completely unsurprising. If they were the sort of people who dig into data and question, they wouldn’t be pushing the idea that vaccines cause autism.   Seriously.

Here’s the section they are relying upon:

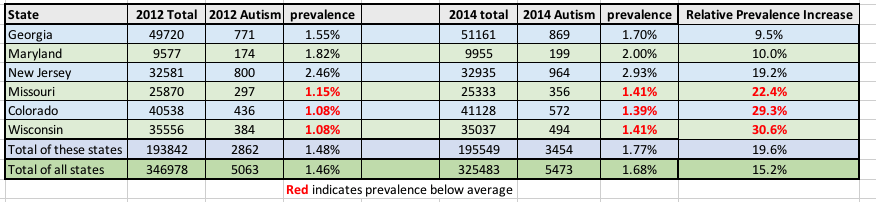
Among the six ADDM sites completing both the 2012 and 2014 studies for the same geographic area, all six showed higher ASD prevalence estimates for 2012 compared to 2014, with a nearly 10% higher prevalence in Georgia (p = 0.06) and Maryland (p = 0.35), 19% in New Jersey (p<0.01), 22% in Missouri (p = 0.01), 29% in Colorado (p<0.01), and 31% in Wisconsin (p<0.01). When combining data from these six sites, ASD prevalence estimates for 2014 were 20% higher for 2014 compared to 2012 (p<0.01).

So, if you only pick the states where there were data in both this study (called 2014 because that’s when the data were collected to be analyzed) and the previous (2012) study, you get about a 20% increase (click to enlarge).

But what happens if you ask “why?”  As in, why do these states show a larger increase than the entire group?

I put some numbers in red and bolded them for emphasis. Those are states with lower than average autism prevalences. Take a moment to think about that–the states with low autism prevalences are showing larger prevalence increases than other states. Start with a low number, and you are bound to get bigger percentage increases.

Missouri, Colorado and Wisconsin started out with very low identification rates.  They’ve improved their identification rates. What if someone were to ask, “how did they do that?  Can we use that elsewhere to serve more unidentified autistic children?”

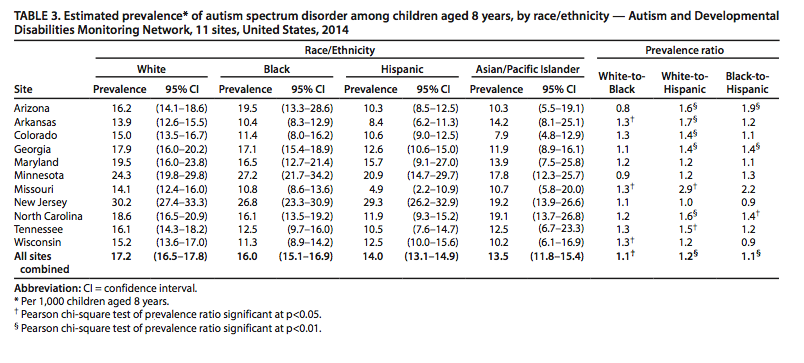
I’m sure the cherry-picking “let’s find a reason to fit this into the vaccines-cause-autism story” groups have already focused on New Jersey in the above figure.  New Jersey stands out–their autism rate increased by about 19% and they have a much higher autism prevalence rate. New Jersey also stands out for another reason: they aren’t lagging in identifying black or Hispanic autistic children:

In New Jersey, there was almost no difference in ASD prevalence estimates among white, black, and Hispanic children. Estimates for Asian/Pacific Islander children ranged from 7.9 per 1,000 (Colorado) to 19.2 per 1,000 (New Jersey) with notably wide CIs.

Wouldn’t it be great if someone were to say, “how did New Jersey close the gap in identifying some minority groups?”

Groups advocating for a better future for disabled people would do that.  People trying to keep the failed “it’s all vaccines fault” idea alive won’t.

Some people will be confused, and understandably so, at this point.  These are “autism prevalence” numbers.  Doesn’t that mean that this is a complete and accurate count of the number of autistic kids in each location?  No, they aren’t.  The people at the CDC are working hard and doing a good job with the information they have.  But this is a review of existing records, not a test of each individual kid.  The CDC have access to medical and/or school records (it varies by location what sort of records they have).

Keep in mind–the CDC autism prevalence numbers aren’t “these are the absolute accurate numbers for how many kids are autistic”. We are missing identifying kids. Doctors are missing autistic kids.  Schools are missing autistic kids. The CDC tries to make up for this by reviewing the records to determine which kids are autistic (i.e. they don’t just count existing diagnoses in the records–they “diagnose” from the records).  But they still miss kids in their counts. We need to get better. The fact that New Jersey isn’t leaving minority kids behind is huge.  The fact that lagging states are catching up is huge.

Doing things right–checking on numbers is hard. It takes time. AoA not only doesn’t take the time to be careful (which is typical for the “vaccines cause autism” groups), they know that it’s the simple message that scares people. “Autism increased by 20%”!!!! It may only take 5 minutes to actually dig and see what’s going on. But that’s five minutes most people don’t have time for.

Which is the long winded way to say:

A lie can travel halfway around the world before the truth can get its boots on

Groups like AoA live and breathe on taking advantage of that.  They were fake news long before the term was coined.

That said, I knew with the new autism prevalence numbers people would misuse them. It’s pretty obvious.  They’ve used that misinformation to drag parents into a world of guilt and shame for being part of vaccine injuries that, in at least the vast majority of cases, didn’t happen.  Even more, the autism-is-a-vaccine epidemic community had the resources for over a decade to make a real difference in the lives of autsitic people. As we watch autism fade a bit from the public’s view, it’s difficult to not cry a bit for the lost opportunity. It’s that, not their failed logic or twisted facts that is why I wrote the above.

By Matt Carey

Americans are still failing to identify and serve minority autistic children

27 Apr

The CDC recently published another autism prevalence study. It’s 23 pages long and has 26 authors, took 2 years to put together and no doubt cost millions of dollars. Out of that, the one fact from it that will be quoted is simply–the autism rate is now at 1.68%, or 1 in 59.

There’s so much more. But sometimes focusing on one simple message makes more impact than a lengthy analysis. So I’ll pick my own simple message (of my own):

we are failing to identify minority autistic children. And with that, we are failing to provide them the appropriate services and supports they deserve as citizens and residents of the U.S.

We can and we should do better.

Here is table 3 from the report:

The estimated autism prevalence for Hispanics is 1.4%. For Whites, it is 1.7%. Thousands of Hispanics and other minorities are being missed. Overall, thousands of autistic children, and many, many more adults, are being missed. But that’s another discussion.

By Matt Carey

Remember the fake supplement OSR #1? It’s still being developed

5 Apr

A few years ago a fake supplement was marketed to autism parents for use on their children. The “supplement” was called “OSR #1”, OSR for “oxidative stress releif” or something to that effect. The name was a bit of a dodge, just as packaging it as a supplement rather than a drug was a dodge. It was/is a chelator. The chemical used–a novel synthetic chemical–was developed for use in environmental heavy metal polution.

This is obvious but worth noting: one can not “supplement” one’s intake of a chemical that humans have never been exposed to before.

If you remember OSR #1, you probably remember that the drug was pulled from the market. But you may be surprised to hear that it may be about to resurface.

The FDA found out that this chelator, this drug, was being sold as a supplement (which avoids thorough tests for safety and efficacy). The FDA sent the Boyd Haley, whose company was selling the “supplement” a warning letter that made it very clear:

The claims listed above make clear that OSR#1 is intended to affect the structure or any function of the body of man or other animals. Accordingly, OSR#l is a drug under section 201(g)(1) of the Act, 21 U.S.C. § 321(g)(1). Disclaimers on your website, such as “OSR#l® is not a drug and no claim is made by CTI Science that OSR#1® can diagnose, treat or cure any illness or disease,” do not alter the fact that the above claims cause your product to be a drug.

Moreover, this product is a new drug, as defined by section 201(p) of the Act, 21 U.S.C. § 321(p), because it is not generally recognized as safe and effective for use under the conditions prescribed, recommended, or suggested in its labeling. Under sections 301(d) and 505(a) of the Act, 21 U.S.C. §§ 331(d) and 355(a), a new drug may not be introduced or delivered for introduction into interstate commerce unless an FDA-approved application is in effect for it. Your sale of OSR#1 without an approved application violates these provisions of the Act.

emphasis added.

Even as a supplement, OSR#1 appeared to be mislabled. Customers were not fully informed of potential side effects, per the FDA letter:

Your website states that” [s]ome reports of temporary diarrhea, constipation, minor headaches have been reported but these are rare and the actual causes are unknown,” as well as “OSR#1 is without detectable toxicity” and “OSR#1® … has not exhibited any detectable toxic effects even at exceptionally high exposure levels.” However, animal studies that you conducted found various side effects to be associated with OSR#1 use, including, but not limited to, soiling of the anogenital area, alopecia on the lower trunk, back and legs, a dark substance on lower trunk and anogenital area, abnormalities of the pancreas, and lymphoid hyperplasia. Based on these animal studies and side effects known to be associated with chelating products that have a similar mechanism of action to OSR#1, we believe the use of your product has the potential to cause side effects, and the before-mentioned website statements falsely assert that the product does not have the potential to cause side effects. Therefore, these statements render your product’s labeling false or misleading. As such, OSR#1 is misbranded under section 502(a) of the Act, 21 U.S.C. § 352(a).

Mr. Haley’s company reportedly sold about $1.5M of OSR#1 as a supplement from his company CTI Science. I saw reports that OSR#1 was selling for about $2/pill so that’s maybe 750,000 pills. That’s a lot for somethiing untested for safety or efficacy. CTI appears to be a shortened version of the original name of the company: Chelator Technologies, Inc.. Chelators are drugs, not supplements.

All this said, CTI Science doesn’t appear to exist any more. If you go to the old website, www.ctiscience.com, you get directed to a non operating website, http://ermesmedical.com/?reqp=1&reqr=.

But obviously I haven’t written all this to say that CTI Science doesn’t exist. It’s not ermesmedical (as their link would suggest), it’s EmeraMed. No idea why they have this confusion over ermesmedical/emeremed. That said, Emeramed describes themselves as:

EmeraMed Limited is a biotechnology firm developing the antidote – heavy metal chelator and antioxidant – Irminix® (Emeramide). The Company is working to obtain marketing authorization in the EU and the US for the treatment of mercury toxicity. Phase 1 and Phase 2a clinical studies have been performed.

They have offices in Ireland, Swedend and the US (Kentucky–home of Boyd Haley). But no mention on the website about who is involved with the company, which I find rather odd. They note that the drug is not yet approved, but that they may be able to supply it to people under an “early access program”. Yes, why wait for actual approval and confirmation of safety and efficacy. This would be for use as a chelator–no mention of work as an autism treatment. There never was a good reason to use this for autism. Boyd Haley was long a proponent that autism is a form of mercury poisoning. Put simply, Boyd Haley was wrong. Very clearly wrong.

Mr. Haley and others may not be named on their website, but on SEC documents, he is named as part of Ermes Medical. If I read this document correctly, they have raised over $3.5M for the company.

As noted in their literature, they have been involved with clinical trials. For mercury poisoning. In Ecuador. No small irony there: many of Mr. Haley’s supporters complain that “big pharma” performs their clinical trials (or experiments, as his supporters would characterize them) in developing countries.

They are still pursuing patents for the treatment neurological disorders. No trial that I have found. Likewise for evidence of efficacy in humans. But a patent application.

A similar patent for treatment of COPD.

Should OSR#1 (under whatever new name) be approved for chelation, we can expect that it will return to the fake autism treatment world. Many still subscribe to the failed idea that autism is caused by mercury poisoning. That idea, pushed by Mr. Haley and others, was based largely on the idea that as mercury exposure from infant vaccines increased, so did the rate of identified autism. Biologically the idea was clearly wrong (autism and mercury poisoning are not similar). Also, even though mercury was removed from infant vaccines, autism rates have not fallen.

All that clear logic said, there still are people who chelate as an “autism treatment” and a new product will almost certainly cause a spike in the numbers trying chelation.

So, yeah, OSR#1 is gone. Except it may return soon under a new name. And likely a higher price tag. And it still won’t be a real treatment for autism.


Matt Carey

Study claims gluten free diet leads to higher levels of heavy metals like mercury

6 Mar

One of the purported treatments for autism is the Gluten-Free/Casein-Free (GFCF) diet. Studies have failed to find a benefit, but the idea persists. Especially among those who believe that autism is a vaccine injury (it isn’t) and that mercury in vaccines contributed to the rise in autism rates (it didn’t).

So there is a huge irony in the possibility, as a recent study suggests, that people on a gluten-free diet have higher levels of mercury and other heavy metals

The study is The Unintended Consequences of a Gluten-Free Diet.

The full study doesn’t appear to be available. This looks like a conference abstract.

That said, check out this table:

table

Total mercury in the blood is 1.7 times higher in people in the gluten-free diet group than in the overall population.

Now, it looks like the units in the table are ng/l, so a total mercury level of 1.3ng/l (that in the gluten-free group) is still well within the normal range (<10ng/l).

Of course it is also worth mentioning that those who promote the gluten-free diet for autistics often have the attitude that no mercury level is safe (which is tough, since there is mercury at some level in just about everything).

So, yeah, ironic but not dangerous. By pushing the gluten-free diet, people may have pushed autistic kids into higher levels of mercury in their blood.

Do we expect Robert Kennedy, SafeMinds, Mark Blaxill, JB Handley, Generation Rescue or any of the others in what was once called the “mercury militia” to inform their groups about this? Sure, if they are really about autism and not about attacking vaccines.

Which is to say, I doubt it.

By Matt Carey

ABC to present “Wacky Church Under Fire Over ‘Miracle Cure’ for Autism”

27 Oct

MMS. Miracle Mineral Solution. CD. Chlorined Dioxide. Call it what you want, it’s a scam. Worse than that, it’s abusive. And thankfully it’s getting some national news attention.

ABC’s 20/20 will present on Friday, Wacky Church Under Fire Over ‘Miracle Cure’ for Autism

Here’s one section of the website for the news segment:

“They’ve got their own Facebook group. There are people admitting to using this stuff on their children. Children are experiencing symptoms,” Eggers said. “You are doing it at the expense of these defenseless children. How, how, how can you not call that evil?”

MMS/CD whatever you want to call it, is sold with a bunch of science-sounding mumbo-jumbo. Believe me (a Ph.D. scientist with 30 years of experience), the explanations given by people like Kerri Rivera and Jim Humble for what MMS does amount to science nonsense.

Thank you ABC for taking this on. Please don’t walk away from this story, keep on it. We need this abuse to end.

By Matt Carey

No, Wakefield’s Autistic Enterocolitis Does Not Exist

2 Sep

Listen to Andrew Wakefield talk for a while and he will tell you his work has been replicated. Usually claiming replicated multiple times and around the world. Since he says it, it gets repeated by his supporters in online discussions.

For those who get dragged into those discussions, here is another paper to reference. This one takes on the idea that there is a bowel disease specific to autism. Wakefield’s “autistic enterocolitis”

People have looked and, guess what, it isn’t there. Yes, autistics get bowel disease. Being autistic doesn’t prevent bowel disease. The fact that some do, indeed, get bowel disease isn’t what Wakefield claimed. He claimed a “new syndrome”.

It doesn’t exist.

Here’s the abstract. The group is reputable and, in fact, has expressed sympathetic views towards Wakefield.

Evaluation of Intestinal Function in Children With Autism and Gastrointestinal Symptoms.

OBJECTIVE:
Alterations in intestinal function, often characterized as a “leaky gut,” have been attributed to children who are on the autism spectrum. Disaccharidase activity, intestinal inflammation, and permeability were analyzed in 61 children with autism and 50 nonautistic individuals with gastrointestinal symptoms.

METHODS:
All patients had duodenal biopsies assayed for lactase, sucrase, maltase, and palatinase activity. Intestinal permeability was evaluated by rhamnose/lactulose test and measured by high-performance liquid chromatography-mass spectrometry. Intestinal inflammation was evaluated by fecal calprotectin and lactoferrin levels using enzyme-linked immunosorbent assay and histology.

RESULTS:
Some children with autism had mild levels of mucosal inflammation on intestinal biopsy. Disaccharidase activity was not different in autistic and nonautistic individuals. Fecal calprotectin and lactoferrin were similar in both groups. Differences between lactulose and rhamnose recovery and lactulose/rhamnose ratio in urine were not statistically different in patients with and without autism.

CONCLUSIONS:
The present study supports the observation that children with autism who have symptoms of gastrointestinal disorders have objective findings similar to children without autism. Neither noninvasive testing nor endoscopic findings identify gastrointestinal pathology specific to autism, but may be of benefit in identifying children with autism who have atypical symptoms.

If you are getting ready to write, “but they might not have seen enough kids to find one with autistic enterocolitis”, according to Wakefield, most of the kids his team tested had his “new syndrome”. If that were true, this team would have found it.

Add this to “MMR causes autism” as one of the failed ideas of Andrew Wakefield. Not that he will ever admit it.


By Matt Carey

If you are using California data to claim an autism epidemic, you’re doing it wrong. Or:The great anti-epidemic of intellectual disability in California.

22 May

If you’ve been reading about autism online, you have almost certainly read that autism “rates” are on the rise. But what if I told you that here in California intellectual disability has been dropping for over 20 years?

For many years the mainstay of the “autism is an epidemic” idea was the California Department of Developmental Services data. The CDDS keeps track of how many Californians are getting support under a number of specific disability categories. These data are publicly available (although not as easily available in the past), which makes them an easy source of data.

It’s easy to take a cursory look at the CDDS data and think “these are official data. Look at how much autism has increased!” Or claim “the CDDS only serves “severe” autism, there’s no way they were missed in the past.” You can even find a few publications to cite to back up these observations.

About a year ago I asked CDDS for some data. I hadn’t checked in a while and I wanted to see what trends are ongoing. Coincidentally, the Autism Society of San Francisco put out a report shortly after that: Autism Rising, A Report on the Increasing Autism Rates in California. So I was not alone in asking for data.  The Autism Society of San Francisco made the argument that the CDDS data are accurate and show an epidemic.

The Autism Society of San Francisco graph the data in many different ways, but the one that was closest to the way I was looking at the data was in Figure 5 (click to enlarge):

AS-SF Autism Rising Figure 5

and here is the caption for Figure 5:

Births of individuals later deemed to have DDS-eligible autism have been increasing sharply every year since the early 1980s. Typically intake into the system occurs between 2 and 7 years of age. The data reflects about 200 DDS autism births per year into the 1980s, but now the system is reflecting nearly 5,000 such births per year. The drop off in cases after birth year 2008 is likely attributable to usual delay in cases entering the system, and likely does not represent an actual decrease in DDS-eligible autism cases.

You can stop there and support your argument. And that’s just what most people do. Or you can question–how can I test if this is a “real” autism increase? For example, is the autism rate the same among different races? The answer is no. Is the autism rate the same in, say, San Francisco, Los Angeles, and Kern County? The answer is no. And there are many more questions one can ask of these data and over and over, the answer is no.

Either we aren’t counting all the autistics in our state, or there is something much more complex going on than vaccine, toxins, epigenetics, or whatever the claimed causes of the rise are. And I’ve gone through many of these discussions over the years. Let’s make this simple then. If one claims that the CDDS counts everyone within each disability category accurately and that the definitions they use aren’t changing with time, why is intellectual disability (mental retardation) dropping so fast in California?

You see I also graphed intellectual disability. I got autism counts, intellectual disability counts and “unduplicated” (total, each disabled person counted once) by birth year. I also got census data by birth year. And I graphed them. And anyone claiming CDDS data show an autism epidemic needs to do the same and to explain this graph, complete with the sharp peak for birth year 1993. (click to enlarge):

CDDS including ID

Intellectual disability has dropped. Off about 40% of the peak value.

If you think your idea for the rise in autism is correct, let’s take the failed vaccine idea as an example, you need to also explain how that resulted in far fewer people with intellectual disability. Plain and simple. And none of these claimed causes of an “epidemic” can explain the drop in ID.

Why bother challenging the people claiming an autism epidemic? Because it denies the existence of undiagnosed autistic adults. We have very little effort to identify those who were missed in past generations. And the likelihood is that these people–our people–are not being supported appropriately because of their misdiagnoses. And not only are we abandoning the misdiagnosed, we are failing to learn. What worked for past generations, the adults of today? What failed? What are the appropriate supports for the various needs of autistic adults? We don’t know today. And are unlikely to know by the time my kid is an adult, especially if we aren’t even looking at autistic adult needs today.

And then there’s the whole autism causation question. People spending their time trying to correlate CDDS data–data clearly confounded by numerous social influences–are unlikely to ever find a real answer.

But, for those who want to keep trying, include all the data. Give an explanation for this and you may be on to something.

CDDS including ID

By Matt Carey

IMFAR (the International Meeting For Autism Research) starts tomorrow.

11 May

IMFAR is the world’s largest autism science conference. I don’t recall the exact statistics, but there are probably over 1000 researchers who attend. Literally hundreds of presentations on various topics. I am not attending, but I will try to write a few articles about abstracts and topics that I think of are interest.

I do know that this year Shannon Rosa (twitter: @shannonrosa) and Carol Greenburg will be attending and tweeting and probably putting some thoughts up at the Thinking Person’s Guide to Autism (twitter: @thinkingautism, Facebook and the TPGA blog.

IMFAR shows what a huge effort is going on in autism research. People are working hard to understand autism and (more importantly) make a difference in the lives of autistics.


By Matt Carey

U.S. announces 2% autism rate. Again. And it’s dependent on a change in the way a survey is worded. Again.

17 Nov

Last week a study was released showing an autism “rate” in the U.S. of about 2% (an estimated prevalence of 2.24% to be exact). Luckily one of the best science journalists out there focuses a lot of her attention on autism and covered this story. I’m writing of course about Emily Willingham and her article Increase In Autism Diagnoses Not An Increase In Autism.

The study in question is Estimated Prevalence of Autism and Other Developmental Disabilities Following Questionnaire Changes in the 2014 National Health Interview Survey. The abstract is at the bottom for those interested.

While other articles are discussing the large “increase in autism”. Or, as in this Reuters article, US autism numbers soar in which we read what must be a confusing message to many:

The results reflect a near doubling in autism rates over the past three years, but the US Centers for Disease Control, which released the data last week, says the shift is largely due to a change in the way the survey was worded.

Here’s the thing, before I saw what the study was, I actually thought that the discussion was about this study: Changes in Prevalence of Parent-reported Autism Spectrum Disorder in School-aged U.S. Children: 2007 to 2011–2012. In that study, released in 2013, a 2% autism “rate” was announced. And that was a significant change from the previous survey data (using the National Survey of Children’s Health). And like previous estimates based on survey’s the change is at least due in large part to a change in the way the survey was presented to parents (I’m looking for a link to the discussion of the change in survey questions that affected the 2013 estimate, but there was a shift and it had a big impact).

Thankfully much of the media, and even Autism Speaks, are pointing out how this 2% figure doesn’t represent a “real” change in autism prevalence, but is largely dependent on the study methods. Others can be counted on to shout “epidemic” and ignore some of the key reasons why this doesn’t reflect a real increase.

Number 1 reason–the autism prevalence is basically the same for kids who were 3-10 and kids who were 11-17:

AutPrevalence

A real increase would show up as a higher prevalence for younger kids.

One thing we see is a decrease in disparity for autism prevalence by race/ethnicity. African Americans have a slightly lower autism prevalence (it’s unclear whether this is statistically significant or not), and Hispanics have a decidedly lower autism prevalence (1.49% vs. 2.55% for Caucasians). Which means we still have far to go to identify and bring services to all autistics. And it also means that the autism prevalence estimates will continue to rise as we do identify more in under diagnosed populations.

AutPrevalence race-ethnicity

But let’s focus on the important part of that–we still have a large under-diagnosed/under-served population and it is largely among Hispanics. We really need to be focusing more attention on remedying that situation.

Here is the abstract for the current study:

Objectives—The developmental disabilities questions in the 2014 National Health Interview Survey (NHIS) were changed from previous years, including
question reordering and a new approach to asking about autism spectrum disorder (ASD). This report examines survey-based estimates of the lifetime
prevalence of ASD, intellectual disability (ID), and any other developmental delay (other DD) following the inclusion of a standalone ASD question, the
inclusion of specific diagnoses in the ASD question, and the ASD question preceding the other DD question, and compares them with estimates from
previous years.

Methods—In NHIS, one child is randomly selected from each family to be the subject of detailed questions on health conditions, functional limitations, and
health care utilization. Parents are asked if a doctor or health professional had ever told them that their child had each of a series of developmental disabilities.
Prevalence estimates of ASD, ID, and other DD for children aged 3–17 years were calculated using data collected in 2011–2014.

Results—The estimated prevalence of ASD based on 2014 data was 2.24%, a significant increase from the estimated annualized prevalence of 1.25% based on
2011–2013 data. In contrast, the prevalence of other DD declined significantly from 4.84% based on 2011–2013 data to 3.57% based on 2014 data. The prevalence of ID did not significantly change from 2011–2013 (1.27%) to 2014 (1.10%). The prevalence of having any of the three conditions was constant across survey years.

Conclusions—The revised question ordering and new approach to asking about developmental disabilities in the 2014 NHIS likely affected the prevalence estimates of these conditions. In previous years, it is likely that some parents of children diagnosed with ASD reported this developmental disability as other DD instead of, or in addition to, ASD. Following these changes, the 2014 ASD estimate was more similar to ASD prevalence estimates from other sources.


By Matt Carey